Introduction:
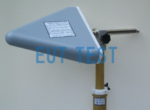
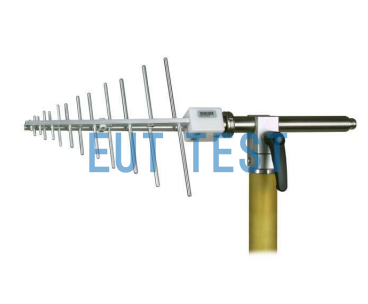
The USLP 9142 is a log-periodic antenna from Schwarzbeck MESS, Germany. The antenna's antenna coefficient stays in the range of 23-39 dB/m over the full operating frequency range, and you may need to add a preamplifier to increase the signal-to-noise ratio in actual testing. Suitable for both UHF and SHF bands, the antenna maintains linear polarization over the 650MHz-8000MHz range, and can be used in EMC laboratories for RF field strength emission and RF radiation reception testing of the object under test in a wave darkroom. The antenna is authorized to be sold and serviced by EUTTEST in China, please contact our sales for quotation information.
UHF and VHF bands What are they?
The Chinese name, English name, and frequency range of UHF and VHF are shown below, respectively:
Very High Frequency (VHF) : 30MHz-300MHz
Ultra High Frequency (UHF) : 300MHz-3GHz
UHF and VHF can transmit both analog and digital information in practical use.
For a definition of the radio frequency bands available globally and a description of their utilization, please refer to: Radio Magnetic Spectrum Division Frequencies and Utilization .
Technical parameters:
<<<<提醒:左右滑动表格>>>>| Antenna Model | USLP 9142 |
| producers | Schwarzbeck |
| exporting countries | German |
| China Import Agent Service Provider | Euttest.com |
| Typical test frequency range | 800MHz-5000MHz |
| Extended test frequency range | 650MHz-8000MHz |
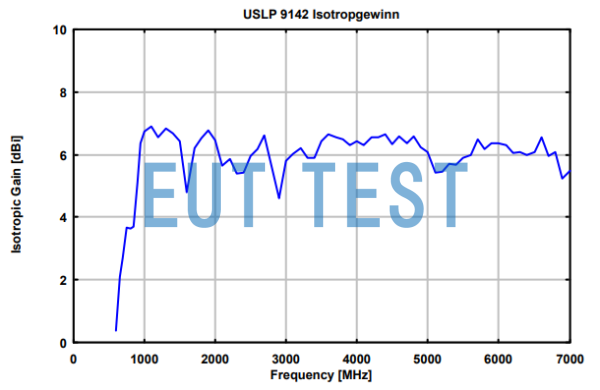
| isotropic gain | 4-7 dBi, see Figure 1 below for gain curves |
| radiance factor | 23-38dB/m |
| Input impedance | 50Ω, N-Type |
| standing wave ratio (physics) | <1.5 |
| 3dB wave width - electric field | 50°-75° |
| 3dB flap width - magnetic field | 90°-120° |
| Maximum input power | Maximum input 300W at 1GHz Maximum input 150W at 5GHz |
| size | 200mm*455mm*40mm |
| weight | 0.55kg |
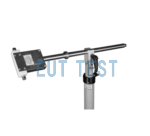
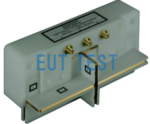
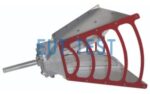
| Optional Adaptive Antenna Mount | AM9144 |
| Optional antenna mast adapter | AA9209, AA9202, etc. |
Graph of related technical parameters:
EMC test engineers can read the gain and antenna coefficient of the logarithmic period antenna directly from the XY coordinates of the following charts and apply them to EMC tests. You can also get the data table from the factory calibration certificate provided with the shipment.

Figure 1: Isotropic gain curve data plot