Introduction:
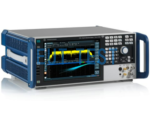
The R&S FSH Spectrum Analyzer is a rugged handheld spectrum analyzer manufactured by R&S and distributed by EUTTEST in Germany, the FSH sequence includes models: FSH4, FSH8, FSH13, FSH20. The R&S FSH Handheld Spectrum Analyzer is designed for field use, it is lightweight, simple in structure, easy to operate, and has a wide range of measurement functions. These advantages make the FSH an indispensable tool for those who need an efficient measurement device when working outdoors.
R&S FSH Equipment Characteristics:
- Frequency range: 9 kHz to 3.6 GHz or 8 GHz, 13.6 GHz, 20 GHz
- High sensitivity (<-141 dBm (1 Hz), <-161 dBm (1 Hz) with preamplifier)
- Low measurement uncertainty (<1 dB)
- Measurement functions for all important tasks related to the installation and maintenance of transmitter systems
- Optional built-in tracking signal generator and VSWR bridge with DC bias power supply
- Dual Port Network Analyzer
- Easy-to-replace lithium-ion battery with up to 4.5 hours of operating time
- Rugged waterproof housing for harsh working conditions in the field
- Lightweight (3 kg with battery), easy to hold, function keys within easy reach Measurement results can be saved on SD card
- LAN and USB interfaces for remote control and measurement data transfer
R&S FSH Sequence Product Technical Data:
The R&S FSH is available in FSH4, FSH8, FSH13 and FSH20 models, please check the table below to select the appropriate test equipment and contact EUTTEST for a quote.
<<<<提醒:左右滑动表格>>>>| spectrum analyzer | R&S®FSH4 | R&S®FSH8 | R&S®FSH13 | R&S®FSH20 | |
| Frequency range Frequency range | Model Version .04/.14/.08/.18 /.13/.23 /.20/.30 | 9 kHz to 3.6 GHz | 9 kHz to 8 GHz | 9 kHz to 13.6 GHz | 9 kHz to 20 GHz |
| Model .24/.28 | 100 kHz to 3.6 GHz | 100 kHz to 8 GHz | - | - | |
| quote | Shenzhen EUTTEST | Shenzhen EUTTEST | Shenzhen EUTTEST | Shenzhen EUTTEST | Shenzhen EUTTEST |
| Resolution bandwidth | 1 Hz to 3 MHz | ||||
| Display average noise level | No preamplifier, resolution bandwidth = 1 Hz (normalized) | ||||
| 9 kHz to 100 kHz (Model .04/.14/.08/.18 only) | < -108 dBm, typical -118 dBm | < -96 dBm, typical -106 dBm | |||
| 100 kHz to 1 MHz | < -115 dBm, typical -125 dBm | ||||
| 1 MHz to 10 MHz | < -136 dBm, typical -144 dBm | ||||
| 10 MHz to 2 GHz | < -141 dBm, typical -146 dBm | ||||
| 2 GHz to 3.6 GHz | < -138 dBm, typical -143 dBm | ||||
| 3.6 GHz to 5 GHz | - | < -142 dBm, typical -146 dBm | |||
| 5 GHz to 6.5 GHz | - | < -140 dBm, typical -144 dBm | |||
| 6.5 GHz to 13.6 GHz | - | < -136 dBm, typical -141 dBm | |||
| 13.6 GHz to 18 GHz | - | - | - | < -134 dBm. Typical -139 dBm | |
| 18 GHz to 20 GHz | - | - | - | < -130 dBm. Typical -135 dBm | |
| With preamplifier, resolution bandwidth = 1 Hz (standardized) | |||||
| 100 kHz to 1 MHz | < -133 dBm, typical -143 dBm | - | |||
| 1 MHz to 10 MHz | < -157 dBm, typical -161 dBm | < -155 dBm, typical -160 dBm | |||
| 10 MHz to 2 GHz | < -161 dBm, typical -165 dBm | - | |||
| 2 GHz to 3.6 GHz | < -159 dBm, typical -163 dBm | - | |||
| 3.6 GHz to 5 GHz | - | < -155 dBm, typical -159 dBm | |||
| 5 GHz to 6.5 GHz | - | < -151 dBm, typical -155 dBm | |||
| 6.5 GHz to 8 GHz | - | < -147 dBm, typical -150 dBm | |||
| 8 GHz to 13.6 GHz | - | - | < -158 dBm, typical -162 dBm | ||
| 13.6 GHz to 18 GHz | - | - | < -155 dBm, typical -160 dBm | ||
| 18 GHz to 20 GHz | - | - | - | < -150 dBm. Typical -155 dBm | |
| Third order cutoff (IP3) | 300 MHz to 3.6 GHz | > 10 dBm, typical +15 dBm | |||
| 3.6 GHz to 20 GHz | - | > 3 dBm, typical +10 dBm | |||
| phase noise | Frequency 500 MHz | ||||
| 30 kHz carrier bias | <-95 dBc (1 Hz), typical -105 dBc (1 Hz) | ||||
| 100 kHz carrier bias | <-100 dBc (1 Hz), typical -110 dBc (1 Hz) | ||||
| 1 MHz carrier bias | <-120 dBc (1 Hz), typical -127 dBc (1 Hz) | ||||
| oscillograph | Sampling value, Maximum peak value, Minimum peak value, Auto peak search, RMS value | ||||
| Level measurement uncertainty | 10 MHz < f ≤ 3.6 GHz | <1 dB, typical 0.5 dB | |||
| 3.6 GHz < f ≤ 20 GHz | - | <1.5 dB, typical 1 dB | |||
| monitor (computer) | 6.5-inch color LCD display with VGA resolution | ||||
| Battery Life (no tracking source) | R&S®HA-Z204, 4.5 Ah | Maximum 3 h | |||
| R&S®HA-Z206, 6.75 Ah | Maximum 4.5 h | ||||
| Dimensions (W × H × D) | 194 mm × 300 mm × 69 mm (144 mm) 1) 7.6 in × 11.8 in × 2.7 in (5.7 in) | ||||
| weight | 3 kg (6.6 lb) | ||||
R&S FSH Host List
<<<<提醒:左右滑动表格>>>>| name (of a thing) | typology | order number |
| basic unit | ||
| Handheld Spectrum Analyzer, 9 kHz to 3.6 GHz, with Preamplifier | R&S®FSH4 | 1309.6000.04 |
| Handheld Spectrum Analyzer, 9 kHz to 3.6 GHz, with Preamplifier and Tracking Source | R&S®FSH4 | 1309.6000.14 |
| Handheld Spectrum Analyzer, 100 kHz to 3.6 GHz, with Preamplifier, Tracking Source and Internal VSWR Bridge | R&S®FSH4 | 1309.6000.24 |
| Handheld Spectrum Analyzer, 9 kHz to 8 GHz, with Preamplifier | R&S®FSH8 | 1309.6000.08 |
| Handheld Spectrum Analyzer, 9 kHz to 8 GHz, with Preamplifier and Tracking Source | R&S®FSH8 | 1309.6000.18 |
| Handheld Spectrum Analyzer, 100 kHz to 8 GHz, with Preamplifier, Tracking Source and Internal VSWR Bridge | R&S®FSH8 | 1309.6000.28 |
| Handheld Spectrum Analyzer, 9 kHz to 13.6 GHz, with Preamplifier | R&S®FSH13 | 1314.2000.13 |
| Handheld Spectrum Analyzer, 9 kHz to 13.6 GHz, with Preamplifier, Tracking Source (300 kHz to 8 GHz) and Internal VSWR Bridge | R&S®FSH13 | 1314.2000.23 |
| Handheld Spectrum Analyzer, 9 kHz to 20 GHz, with Preamplifier | R&S®FSH20 | 1314.2000.20 |
| Handheld Spectrum Analyzer, 9 kHz to 20 GHz, with Preamplifier, Tracking Source (300 kHz to 8 GHz) and Internal VSWR Bridge | R&S®FSH20 | 1314.2000.30 |
| Annexes provided | ||
| Lithium-ion battery pack, USB cable, LAN cable, AC power supply, CD-ROM describing R&S®InstrumentView software and related documentation, Quick Start Guide | ||
| hardware option | ||
| Lithium-ion battery pack, 6.75 Ah (factory installed; battery capacity upgraded from 4.5 Ah to 6.75 Ah) | R&S®FSH-B106 | 1304.5958.02 |
| Accurate reference frequency, aging rate: < 3.6 × 10⁻⁹ /year | R&S®FSH-Z114 | 1304.5935.02 |
| Software options (usually firmware) | ||
| Waterfall Chart Measurement Applications | R&S®FSH-K14 | 1304.5770.02 |
| Interference Analysis Measurement Applications (Software License) | R&S®FSH-K15 | 1309.7488.02 |
| Geotagging Application (Software License) | R&S®FSH-K16 | 1309.7494.02 |
| Indoor Mapping and Surveying Applications (Software License) | R&S®FSH-K17 | 1304.5893.02 |
| Pulse measurement with power probe (software license). (R&S®FSH-Z129 required for R&S®FSH4/8/13/20 with serial number < 121000) | R&S®FSH-K29 | 1304.5993.02 |
| Fault point distance measurement (only for models .24/.28/.23/.30, R&S®FSH-Z320 or R&S®FSH-Z321 and R&S®FSH-Z28 or R&S®FSH-Z321 recommended) R&S®FSH-Z29) | R&S®FSH-K41 | 1304.5612.02 |
| Vector reflection and transmission measurements (R&S®FSH-Z28 or R&S®FSH-Z29 required for models .24/.28/.23/.30 only) | R&S®FSH-K42 | 1304.5629.02 |
| Vector Voltmeter (R&S®FSH-Z28 or R&S®FSH-Z29 required for models .24/.28/.23/.30 only) | R&S®FSH-K45 | 1304.5658.02 |
| GSM, EDGE measurement applications | R&S®FSH-K10 | 1304.5864.02 |
| 3GPP WCDMA BTS/NodeB Conductivity Channel and EVM Measurement Applications | R&S®FSH-K44 | 1304.5641.02 |
| 3GPP WCDMA BTS/NodeB Code Domain Power Measurement Application (requires R&S®FSH-K44) | R&S®FSH-K44E | 1304.5758.02 |
| CDMA2000® BTS Conductivity Channel and EVM Measurement Applications | R&S®FSH-K46 | 1304.5729.02 |
| CDMA2000® BTS code-domain power measurement applications (requires R&S®FSH-K46) | R&S®FSH-K46E | 1304.5764.02 |
| 1xEV-DO BTS Conductivity Channel and EVM Measurement Applications | R&S®FSH-K47 | 1304.5787.02 |
| 1xEV-DO BTS PN Scanner and Time Domain Power Measurement Application (requires R&S®FSH-K47) | R&S®FSH-K47E | 1304.5806.02 |
| TD-SCDMA BTS Power and EVM Measurements | R&S®FSH-K48 | 1304.5841.02 |
| TD-SCDMA BTS Power and EVM Measurements (requires R&S®FSH-K48) | R&S®FSH-K48E | 1304.5858.02 |
| LTE FDD downlink guide channel and EVM measurement application1) | R&S®FSH-K50 | 1304.5735.02 |
| LTE FDD Downlink Extended Channel and Modulation Measurement Application1) (requires R&S®FSH-K50) | R&S®FSH-K50E | 1304.5793.02 |
| LTE TDD downlink guide channel and EVM measurement applications1) | R&S®FSH-K51 | 1304.5812.02 |
| LTE TDD Downlink Extended Channel and Modulation Measurement Application 1) (requires R&S®FSH-K51) | R&S®FSH-K51E | 1304.5829.02 |
| NB-IoT measurement applications1) | R&S®FSH-K56 | 1318.6100.02 |
| Receiver Mode and Channel Sweep Measurement Applications | R&S®FSH-K43 | 1304.5635.02 |
FSH option:
<<<<提醒:左右滑动表格>>>>| R&S®FSH Options | ||||
| Model .04/.08/.13/.20 | Model .14/.18 | Model .24/.28 | Model .23/.30 | |
| Waterfall chart measurements | R&S®FSH-K14 | R&S®FSH-K14 | R&S®FSH-K14 | R&S®FSH-K14 |
| interference analysis | R&S®FSH-K15 | R&S®FSH-K15 | R&S®FSH-K15 | R&S®FSH-K15 |
| geographic marker | R&S®FSH-K16 | R&S®FSH-K16 | R&S®FSH-K16 | R&S®FSH-K16 |
| Indoor mapping | R&S®FSH-K17 | R&S®FSH-K17 | R&S®FSH-K17 | R&S®FSH-K17 |
| Receiver mode and channel sweep measurements | R&S®FSH-K43 | R&S®FSH-K43 | R&S®FSH-K43 | R&S®FSH-K43 |
| Analyzing GSM/GPRS/EDGE Transmitter Signals | R&S®FSH-K10 | R&S®FSH-K10 | R&S®FSH-K10 | R&S®FSH-K10 |
| Analyzing WCDMA/HSDPA/HSPA+ Transmitter Signals | R&S®FSH-K44 R&S®FSH-K44E | R&S®FSH-K44 R&S®FSH-K44E | R&S®FSH-K44/ R&S®FSH-K44E | R&S®FSH-K44 R&S®FSH-K44E |
| Analyzing CDMA2000® Signals | R&S®FSH-K46 R&S®FSH-K46E | R&S®FSH-K46 R&S®FSH-K46E | R&S®FSH-K46 R&S®FSH-K46E | R&S®FSH-K46 R&S®FSH-K46E |
| Analyzing 1xEV-DO Signals | R&S®FSH-K47 R&S®FSH-K47E | R&S®FSH-K47 R&S®FSH-K47E | R&S®FSH-K47 R&S®FSH-K47E | R&S®FSH-K47 R&S®FSH-K47E |
| Analyzing TD-SCDMA/HSDPA Signals | R&S®FSH-K48 R&S®FSH-K48E | R&S®FSH-K48 R&S®FSH-K48E | R&S®FSH-K48 R&S®FSH-K48E | R&S®FSH-K48 R&S®FSH-K48E |
| Analyzing LTE FDD Signals | R&S®FSH-K50 5) R&S®FSH-K50E | R&S®FSH-K50 5) R&S®FSH-K50E | R&S®FSH-K50 5) R&S®FSH-K50E | R&S®FSH-K50 5) R&S®FSH-K50E |
| Analyzing LTE TDD Signals | R&S®FSH-K51 5) R&S®FSH-K51E | R&S®FSH-K51 5) R&S®FSH-K51E | R&S®FSH-K51 5) R&S®FSH-K51E | R&S®FSH-K51 5) R&S®FSH-K51E |
| Analyzing NB-IoT downlink signals | R&S®FSH-K56 5) | R&S®FSH-K56 5) | R&S®FSH-K56 5) | R&S®FSH-K56 5) |
| Distance to Fault (DTF) Measurement | - | - | R&S®FSH-K41 | R&S®FSH-K41 |
| Vector reflection and transmission measurements (S11 S22 S21 S12) , , , , , , , , , and | - | - | R&S®FSH-K42 | - |
| Single Port Cable Loss Measurement | - | - | R&S®FSH-K42 | - |
| Vector Voltmeter | - | - | R&S®FSH-K45 | R&S®FSH-K45 |
| Power measurement (up to 110 GHz) | See page 25 for details on power probes | |||
| Directional power measurement (up to 1 GHz/4 GHz) | R&S®FSH-Z14 R&S®FSH-Z44 | R&S®FSH-Z14 R&S®FSH-Z44 | R&S®FSH-Z14 R&S®FSH-Z44 | R&S®FSH-Z14 R&S®FSH-Z44 |
| Pulse analysis using power probe 6) | R&S®FSH-K29 | R&S®FSH-K29 | R&S®FSH-K29 | R&S®FSH-K29 |
| Remote control via LAN or USB | R&S®FSH-K40 | R&S®FSH-K40 | R&S®FSH-K40 | R&S®FSH-K40 |
FSH Vector Network Analyzer Option:
<<<<提醒:左右滑动表格>>>>| Vector network analysis1)/Vector Voltmeter2) | ||||
| R&S®FSH4 | R&S®FSH8 | R&S®FSH13/20 | ||
| Frequency range | Model .24/.28/.23/.30 | 300 kHz to 3.6 GHz | 300 kHz to 8 GHz | 100 kHz to 8 GHz |
| Output Power (Port 1) | 0 dBm to -40 dBm | - | ||
| Output Power (Port 2) | 0 dBm to -40 dBm | 0 dBm to -40 dBm | ||
| S ) Reflectometry (S11 22) | ||||
| directionality (molecular biology) | 300 kHz to 3 GHz | > 43 dB rating | > 43 dB rating | > 43 dB rating4) |
| 3 GHz to 3.6 GHz | > 37 dB rating | > 37 dB rating | > 37 dB rating 4) | |
| 3.6 GHz to 6 GHz | - | > 37 dB rating | > 37 dB rating4) | |
| 6 GHz to 8 GHz | - | > 31 dB rating | > 31 dB rating4) | |
| display mode | Vector reflection and transmission measurements (R&S®FSH-K42) | Amplitude, phase, amplitude+phase, Smith's circle plot, VSWR, reflection coefficient, mρ, single port cable loss, electrical length, eut test, group delay | ||
| Vector Voltmeter (R&S®FSH-K45) | Magnitude + Phase, Smith's Circle Chart | |||
| Transmission Measurement | ||||
| Dynamic Range (S21) | 100 kHz to 300 kHz | Typical 70 dB | Typical 70 dB | - |
| 300 kHz to 3.6 GHz | > 70 dB, typical 90 dB | > 70 dB, typical 90 dB | - | |
| 3.6 GHz to 6 GHz | - | > 70 dB, typical 90 dB | - | |
| 6 GHz to 8 GHz | - | Typical 50 dB | - | |
| Dynamic Range (S12) | 100 kHz to 300 kHz | Typical 80 dB | Typical 80 dB | Typical 80 dB |
| 300 kHz to 3.6 GHz | > 80 dB, typical 100 dB | > 80 dB, typical 100 dB | > 80 dB, typical 100 dB | |
| 3.6 GHz to 6 GHz | - | > 80 dB, typical 100 dB | > 80 dB, typical 100 dB | |
| 6 GHz to 8 GHz | - | Typical 60 dB | Typical 60 dB | |
| display mode | Vector reflection and transmission measurements (R&S®FSH-K42) | Amplitude (attenuation, gain), phase, amplitude + phase, electrical length, group delay | ||
| Vector Voltmeter (R&S®FSH-K45) | Amplitude + Phase | |||
FSH Utilization:
<<<<提醒:左右滑动表格>>>>The R&S FSH can be used for installation and maintenance of transmitter stations:
| The R&S FSH can be used for disturbance analysis, geo-tagging and indoor mapping.
FSH Electromagnetic Field Measurements
Diagnostic applications in FSH laboratories or services
FSH archiving and remote control
|